Some articles have not been moved to our new site yet.
As a result you have been redirected to our old site.
If you wish to return to our new site -
click here.
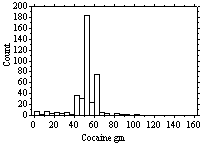
Cocaine - Prices & Frequency of use (1999)
Range
of Cocaine Gram Prices 1999

|
Cocaine gram - 1999 prices by
region
|
|
Group:
|
Count:
|
Mean:
|
Std. Dev.:
|
Std. Error:
|
|
London
|
115
|
58.14
|
68.23
|
6.36
|
|
South East
|
60
|
50
|
10.89
|
1.41
|
|
South West
|
80
|
49.81
|
12.93
|
1.45
|
|
East Anglia
|
24
|
48.75
|
14.01
|
2.86
|
|
Midlands
|
30
|
42
|
14.83
|
2.71
|
|
Wales
|
22
|
47.55
|
10.63
|
2.27
|
|
Yorks/Humbs
|
15
|
46.67
|
12.91
|
3.33
|
|
North West
|
28
|
46.61
|
7.82
|
1.48
|
|
North East
|
6
|
45
|
5.48
|
2.24
|
|
Scotland
|
8
|
51.25
|
8.35
|
2.95
|
|
Other/not stated
|
18
|
38.39
|
19.52
|
4.6
|
|
Overall
|
406
|
50.55
|
38.1
|
1.89
|
|
Cocaine Ounce Prices
|
|
Group:
|
Count:
|
Mean:
|
|
London
|
6
|
340.83
|
|
South East
|
7
|
956.43
|
|
South West
|
6
|
626.67
|
|
East Anglia
|
2
|
950
|
|
Midlands
|
2
|
565
|
|
Wales
|
3
|
766.67
|
|
Yorks/Humbs
|
0
|
s
|
|
North West
|
2
|
525
|
|
North East
|
3
|
391.67
|
|
Scotland
|
0
|
s
|
|
Other/not stated
|
2
|
1100
|
|
Overall
|
33
|
674.39
|
Cocaine prices
in 1999 were virtualy unchanged from previous years, at
around £50 per gram.
Frequency
of Use (cocaine)
|
Frequency
|
Count
|
% of responses
|
% of users
|
% excl missing
|
Overall %
|
|
EXP
|
350
|
30.70
|
39.37
|
21.03
|
16.11
|
|
OCC
|
253
|
22.19
|
28.46
|
15.20
|
11.64
|
|
REG
|
157
|
13.77
|
17.66
|
9.44
|
7.23
|
|
DAI
|
6
|
0.53
|
0.67
|
0.36
|
0.28
|
|
STO
|
123
|
10.79
|
13.84
|
7.39
|
5.66
|
|
NEV
|
251
|
22.02
|
28.23
|
15.08
|
11.55
|
|
MIS
|
1033
|
90.61
|
|
62.08
|
47.54
|
|
Total Ever
|
889
|
|
|
53.43
|
40.91
|
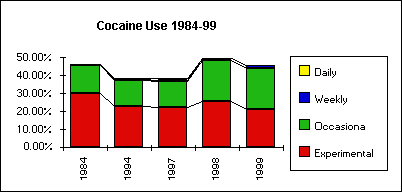
The proportion
of drug users who have tried cocaine remains stable at
around 50%, although this represents an increase since
the early 1990s. Roughly 10% would use monthly or more
often, but only 1.5% (3% of cocaine users) would use daily
(see below). Cocaine use tends to be episodic, ranging
from occasional use at parties, to heavy binge use followed
by periods of abstinence.
Long Term
Trends in cocaine use
|
Trends
in Cocaine use 1984-99
|
|
Frequency
of use
|
1984
|
1994
|
1997
|
1998
|
1999
|
|
Non/ex-users
|
50.40%
|
61.50%
|
61.70%
|
50.00%
|
53.96%
|
|
Experimental
|
30.10%
|
22.90%
|
22.40%
|
25.90%
|
21.03%
|
|
Occasional
|
15.50%
|
14.60%
|
14.60%
|
22.60%
|
23.08%
|
|
Weekly
|
0.80%
|
0.70%
|
0.60%
|
1.00%
|
1.56%
|
|
Daily
|
0%
|
0.40%
|
0.70%
|
0.40%
|
0.36%
|

Methodological
Note - In 1999, the survey included a larger number of
respondents from the London and Bristol areas attending
free events, with a different demographic profile to sites
in previous years.